Welcome to the game_the0ry demo! This is a sample of what we can build for you – for free.
Our demo features full membership support, native search and comments, dark, partial dark, and light modes, various layouts with extensive customization options, language translations and much more.
Site Features
Light, Partial Dark and Dark Modes
Fully Customizable (without editing templates!)
Super-fast Loading
Fully Mobile Responsive
Compatible with Modern Browsers
Updated Regularly
Fast & Friendly Support
Post, Page, Tag and Author pages
Responsive Images
Featured Posts
Reading Time
Next and Previous Post Navigation
Custom Sharing Options
Members & Subscriptions
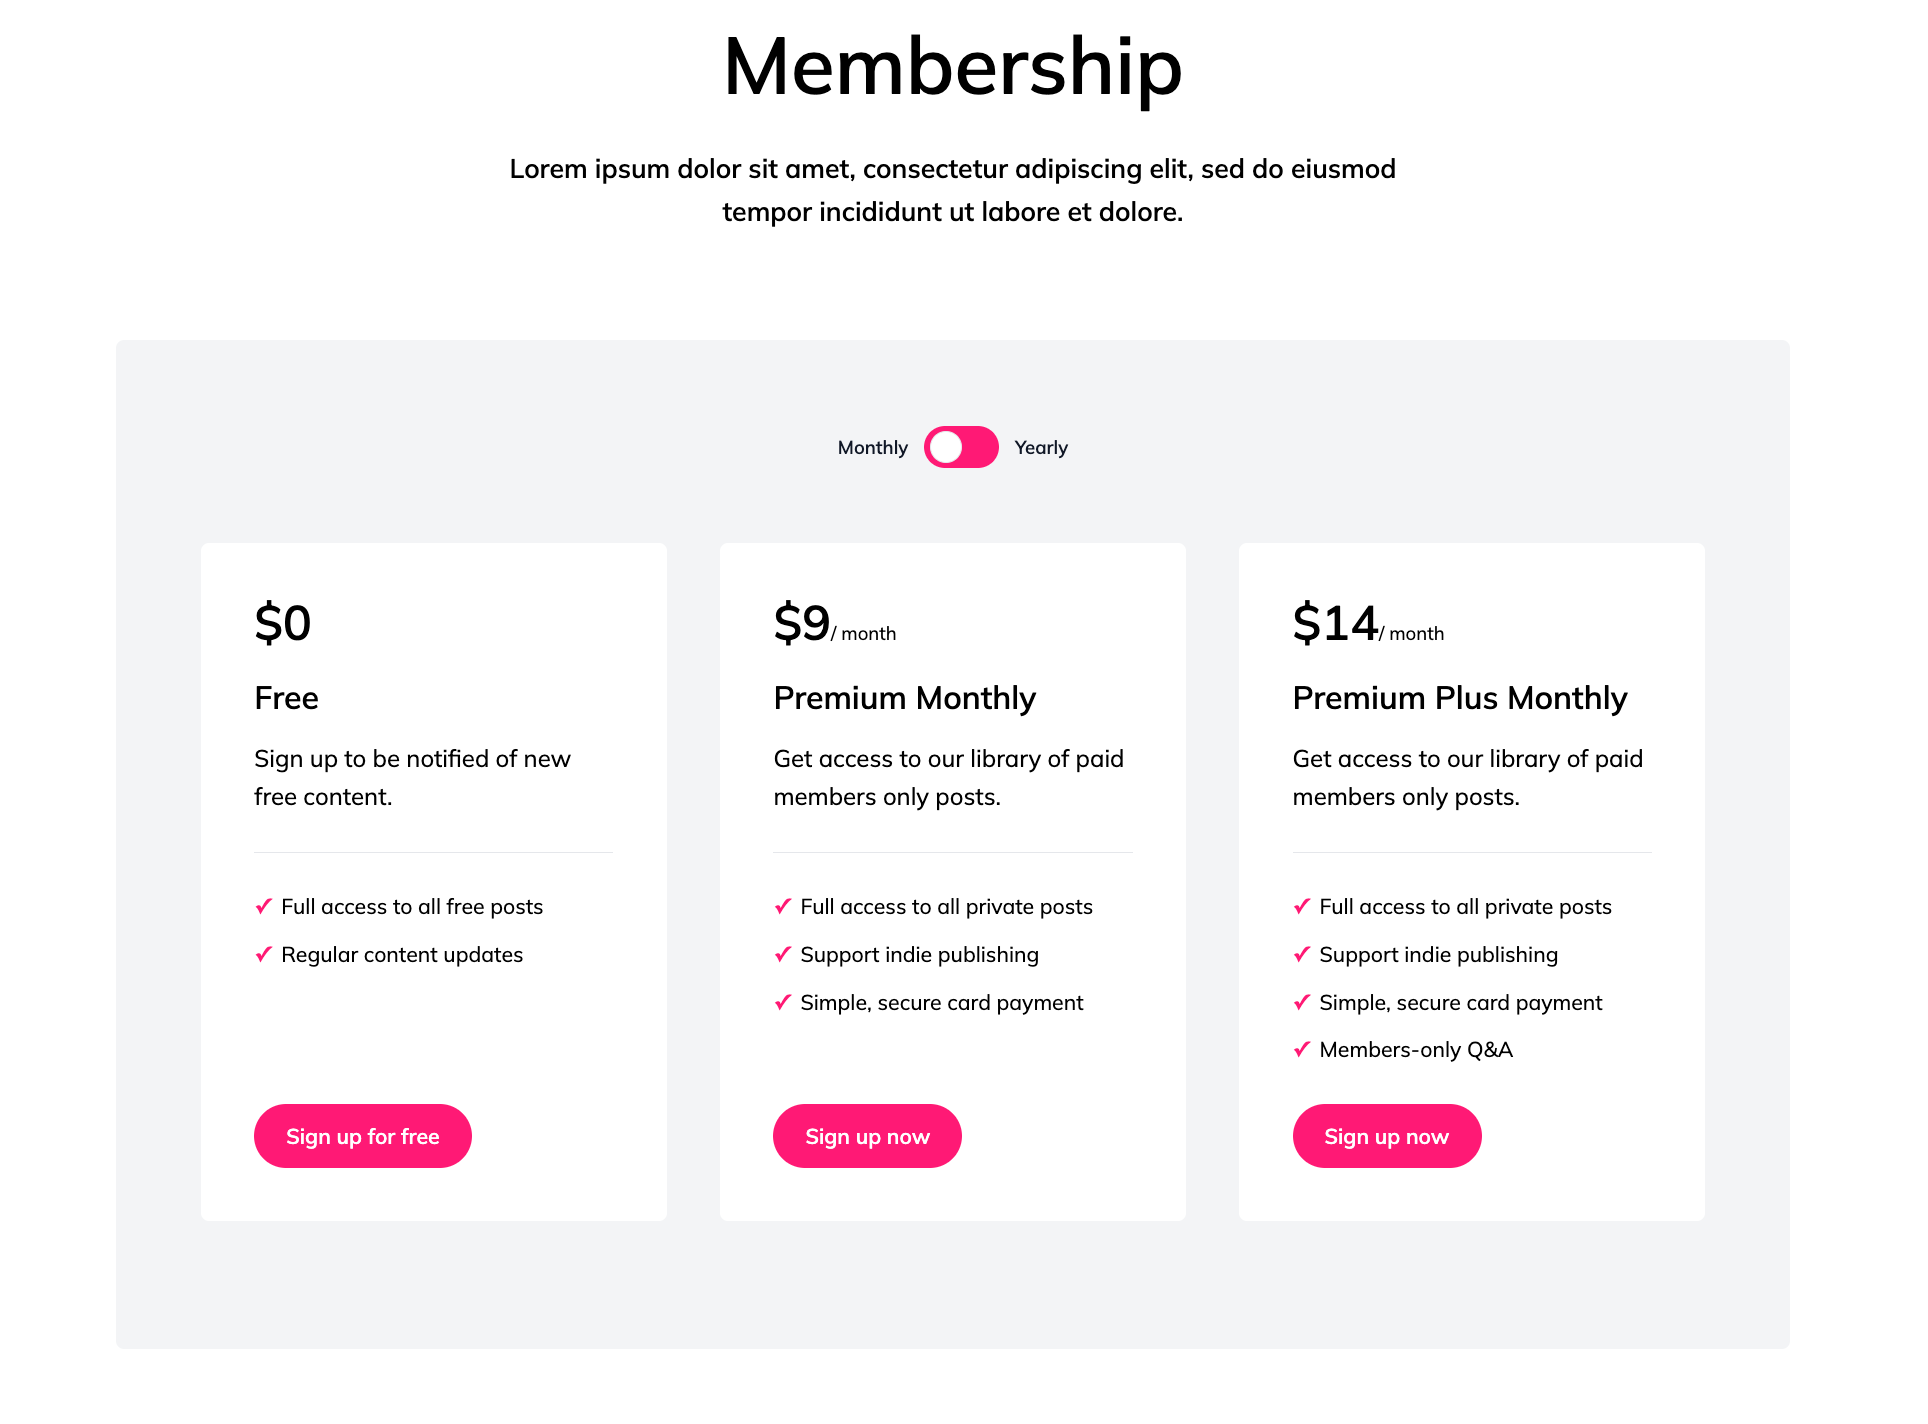
Membership Page
Membership Tiers
Free Trial Period
Account Page For Members so they can manager their own subscription
Custom Sign-In Page
Custom Sign-Up Page
Custom Call-to-Action in Post for Members
Custom Call-to-Action in Post for Paid-Members
FAQ Section on Membership Page
Sign-In, Sign-Up, Subscribe and Checkout custom notifications
Member Avatars
Cancel & Continue Subscription Button
Padlock Icon on Post-cards for Member-only Posts
Option to Edit Billing Info
Custom Currency Support
Public Preview For Members Posts
Analytics
Post analytics in the site admin panel gives you easy access to track your audience’s engagement with the content you publish.
To help you get the most out of post analytics, here’s an overview of the data that the site collects and displays.
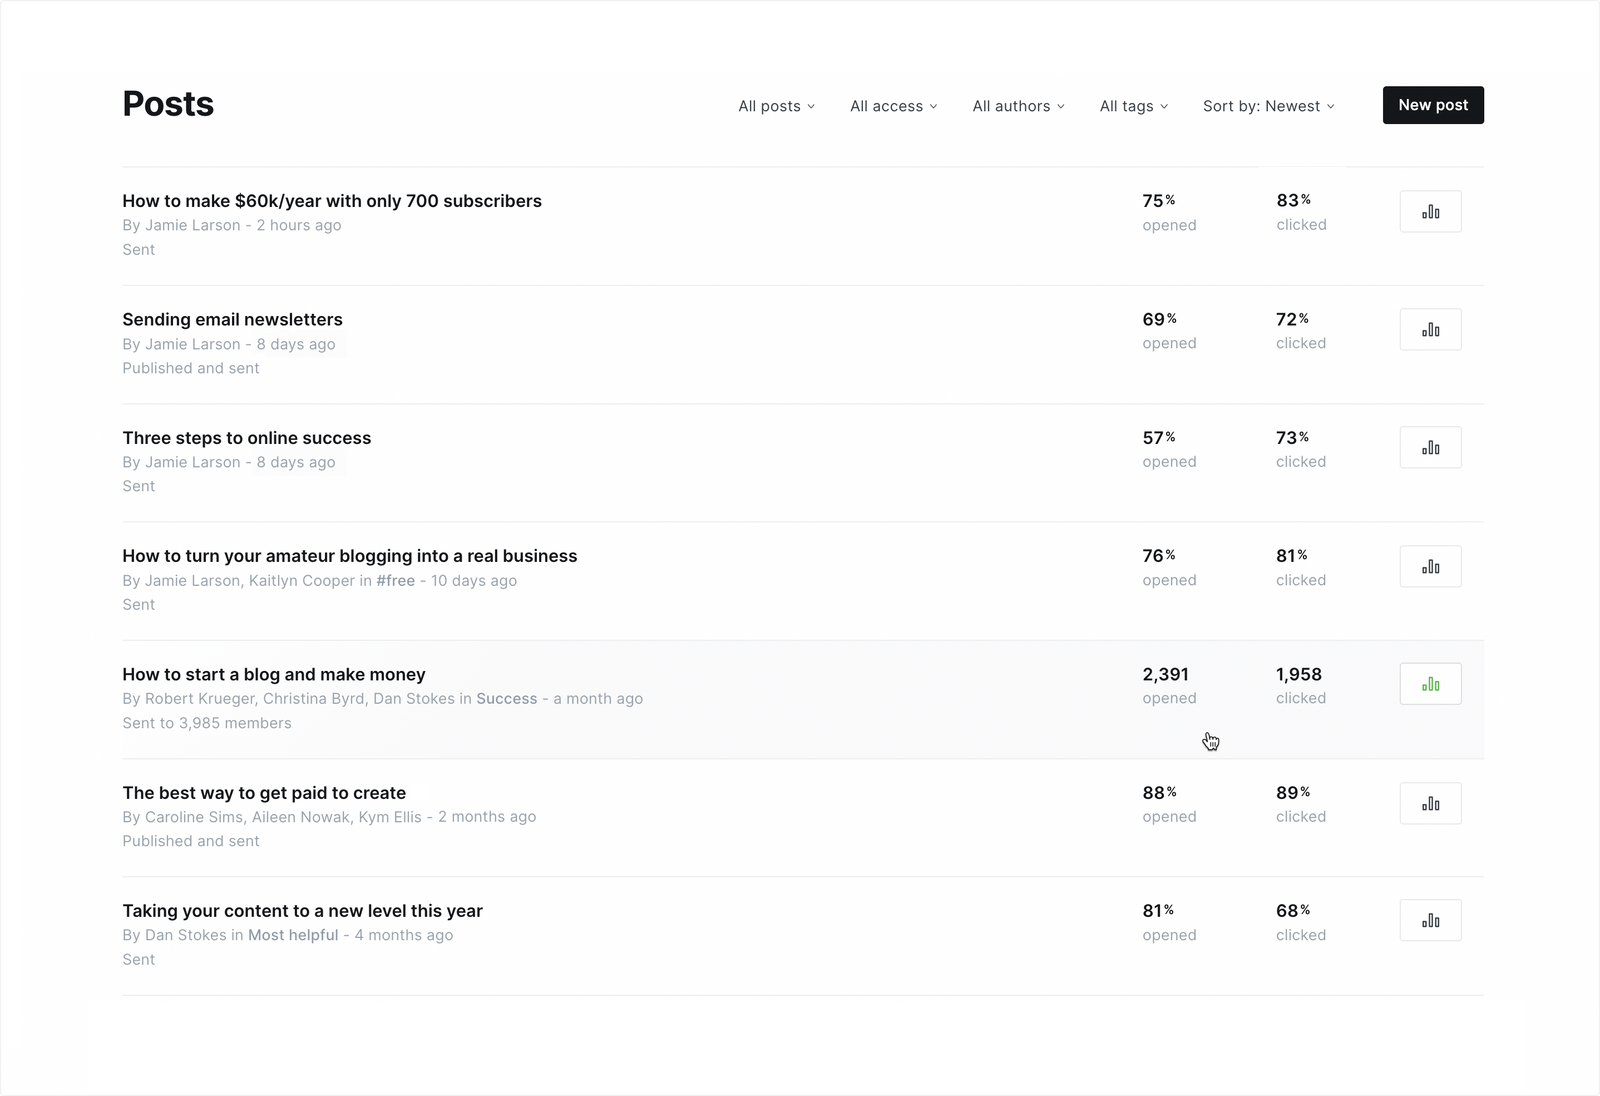
The post list displays metrics that you can see at a quick glance, including:
Opens — The number of members that opened your newsletter. The open rate, shown as a percentage, is the number of openers divided by the number that received the newsletter
Clicks — a count of the number of unique members that clicked any link contained within your newsletter. The click rate, also shown as a percentage, is the number of members that clicked a link divided by the number that received the newsletter.
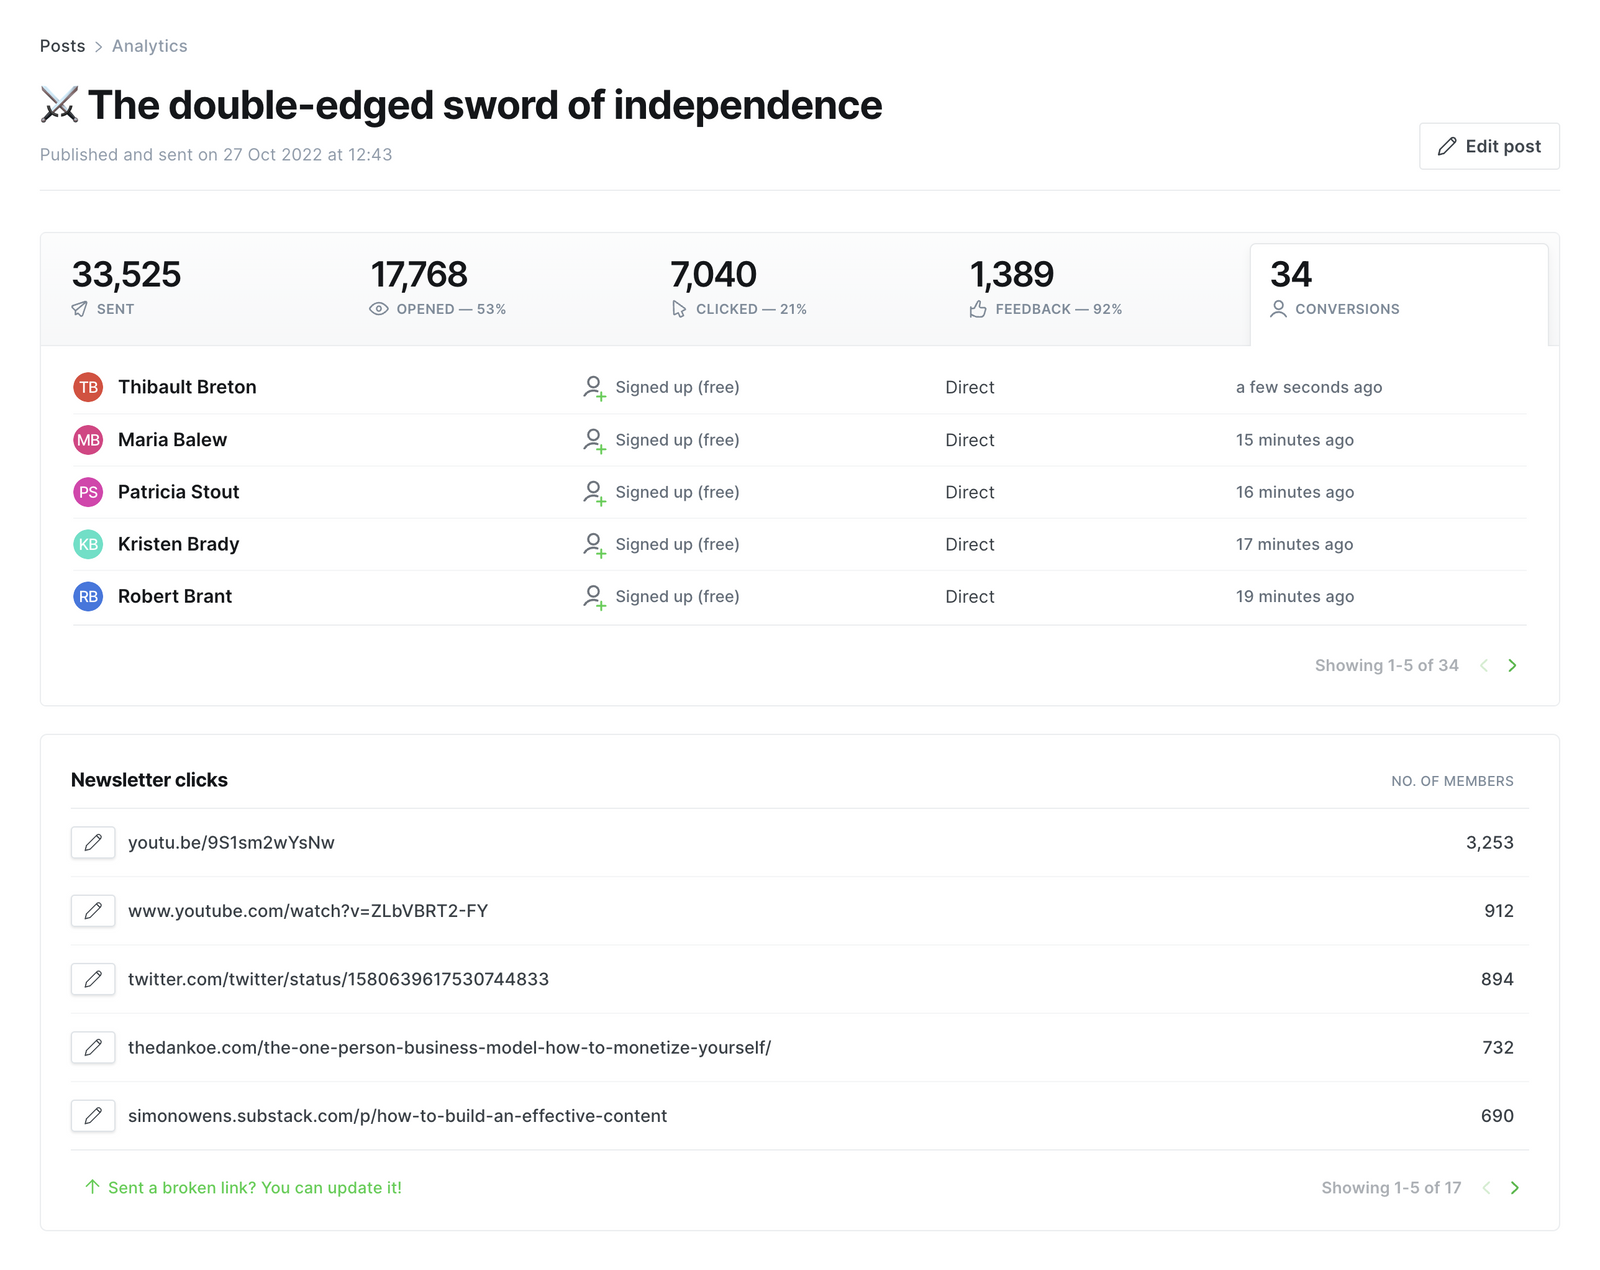
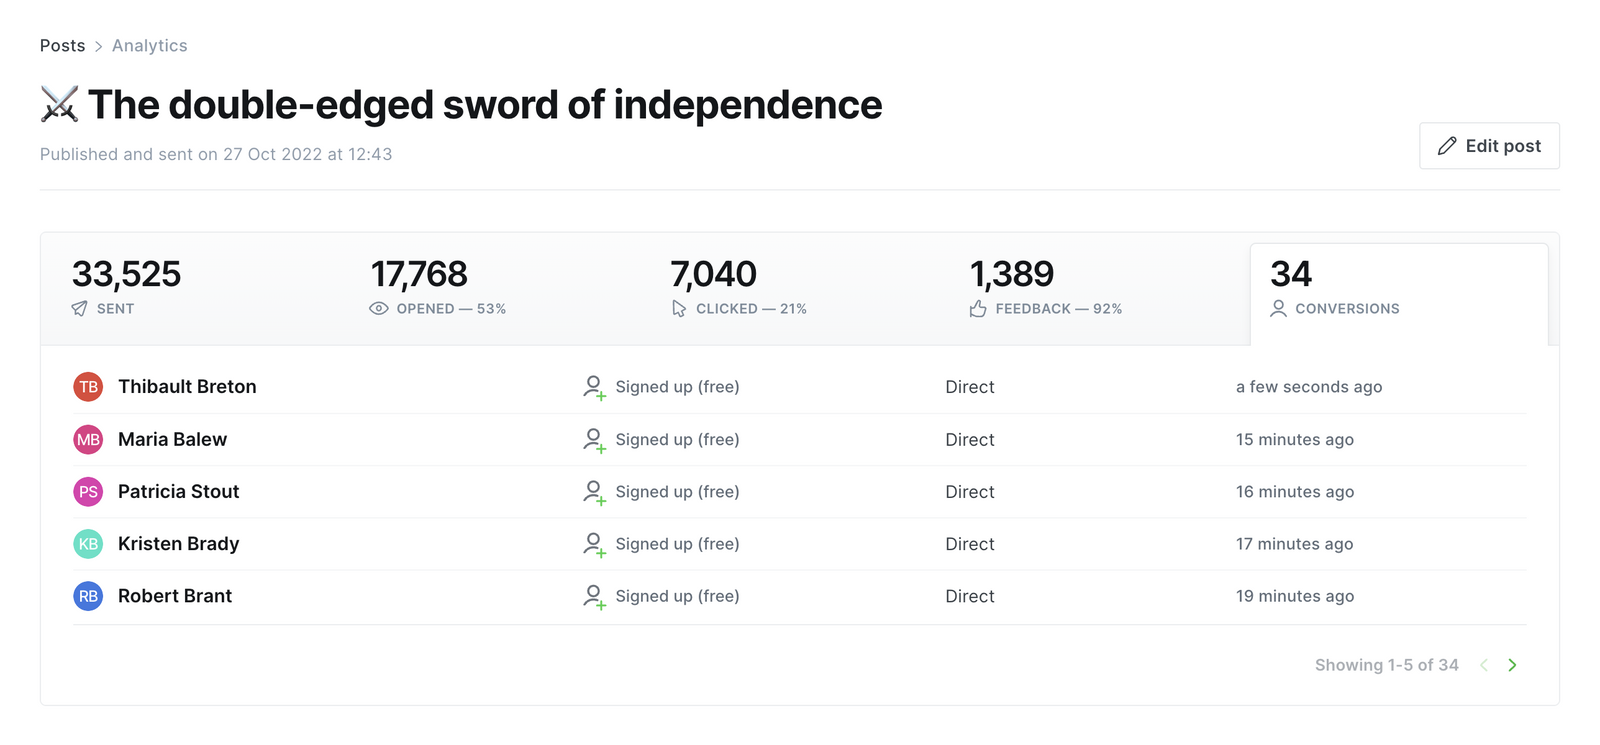
Post analytics
Clicking the graph icon next to each post provides even more insight on member engagement and click data for the content you publish and send on your site.
These analytics provide an overview of how well each email newsletter has performed, how many member conversions each piece of content has driven, and the referral sources for those conversions.
Engagement
The Engagement section of your stats gives you a high level overview of:
Emails sent — The number of members who were sent your newsletter.
Emails opened — The open rate percentage and number of opens.
Clicks — The click percentage and number of clicks to links in your newsletter.
Feedback — A breakdown of the feedback your members provided when reading your newsletter.
Conversions — A list of members who signed up or started a paid subscription after reading the post and the source for each signup.
Conversions include new free and paid members who signed up from your post. You can also dig into which members signed up from each post or page by using filters on the members dashboard.
The source shows where each new member signup came from, giving you a better idea of how people are discovering your work online.
Newsletter clicks
The Newsletter clicks section gives an overview of the links within your content that members are interacting with the most.
Each link within the newsletter appears in this section, alongside how many unique members have clicked on it. You can also edit links in newsletters after they've been sent if you need to make a correction.